2026
Analizcim
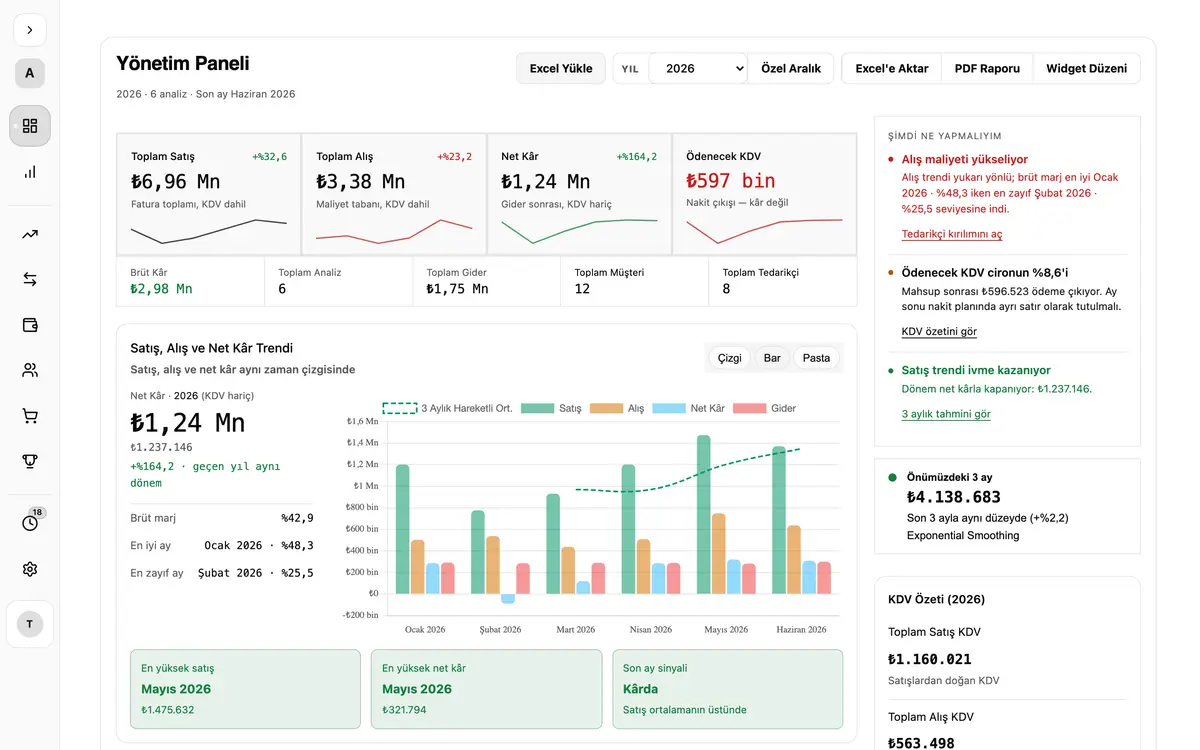
An analysis app that turns a family company’s scattered Excel financial data into a dashboard answering three questions: where things stand, where the risk is, and what to do next.
The problem
Üniversal Plastik kept its sales, purchase, expense and VAT data in Excel files. The numbers were there but the answers were not: which month margins narrowed, where spending slipped, where the coming period was heading — all of it was worked out by hand.
What I built
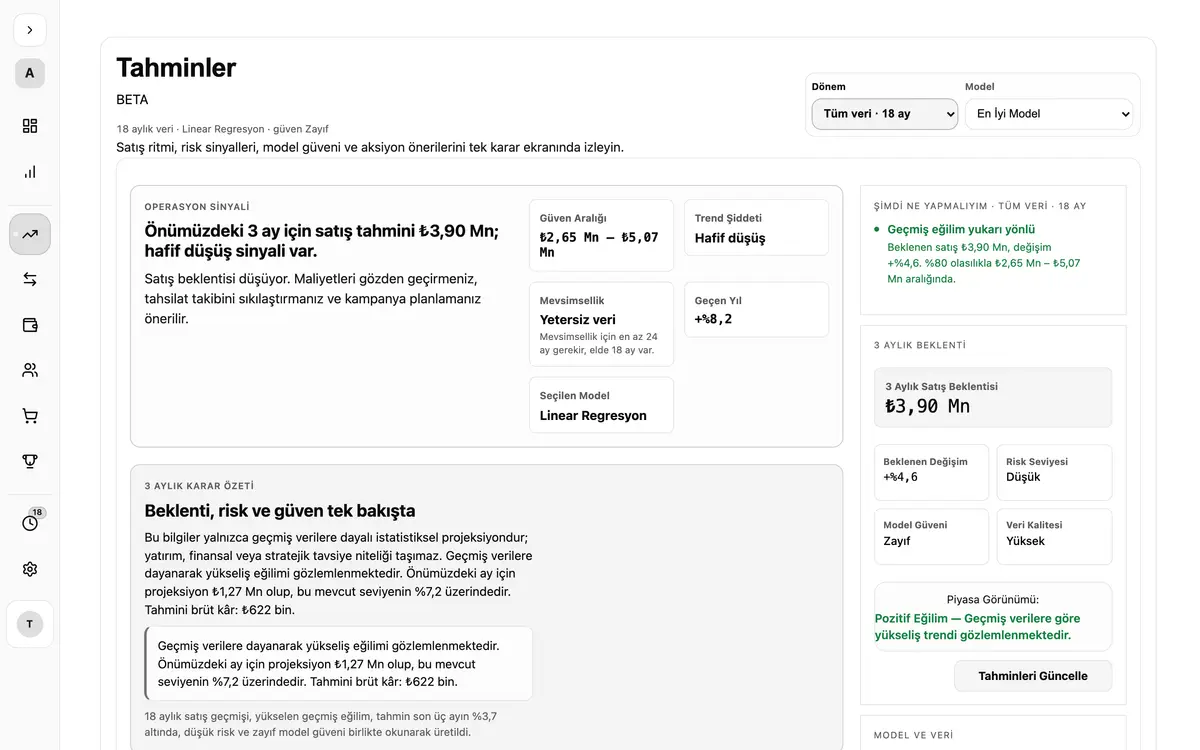
A web application that reads the Excel files and produces sales, purchase, profit, VAT and expense analyses, with a forecasting layer on top that compares four methods — linear, exponential smoothing, Holt-Winters and ARIMA — and picks whichever fits the data with the lowest error. Dashboard shows where things stand and Forecasts shows the period ahead, alongside screens for current-account detail, year-on-year comparison, expense management and the most active items. Built with Node.js, Express and SQLite.
The data never leaves the machine
The application runs locally, so financial data stays on the user’s own computer. That was the first design decision I made for a tool that handles company data.
Two rules for getting it right
Before I call a fix done, I break the code on purpose and check that a test catches it; if no test catches it, the fix is not locked in. And I prove any claim about what the screen shows from the browser itself, tagging every finding as either "screen verified" or "engine only". Today 179 unit tests and 36 integration tests keep doing that work.
Status
Running on the company’s real data: more than 10,000 sales line items processed so far. In active use and still growing. The source code is public.